Private beta · launching in 27 days

Every Statement, rebased one way.

Rebase standardizes every filing onto a single, defensible basis so the C-suite never has to choose which version of the numbers to believe with every figure tracing back to its source.

Every filing on one basis, traced to source.

Be first when we launch. One email at launch - no spam.

Three analysts, three answers
Days Sales Outstanding · sample company
Analyst A
46 days
Analyst B
52 days
Analyst C
76 days
Rebase · one basis
traced to source
60 days
One basis. One number to trust.
Rebase engineRebased

Days Sales Outstanding - same company, same filing, three readings

Reading A45days
Reading B51days
Reading C75days
Rebase · one basis
60days
traced to source
Every statement, line-for-lineTraced to source
Profit & LossBalance SheetCash FlowEquity

Every statement, normalized onto one defensible basis

Profit & LossBalance SheetCash FlowChanges in EquityEvery figure traced to source
The platform

Two ways in.
One source of truth.

4 statements200+ metricsTraced to source
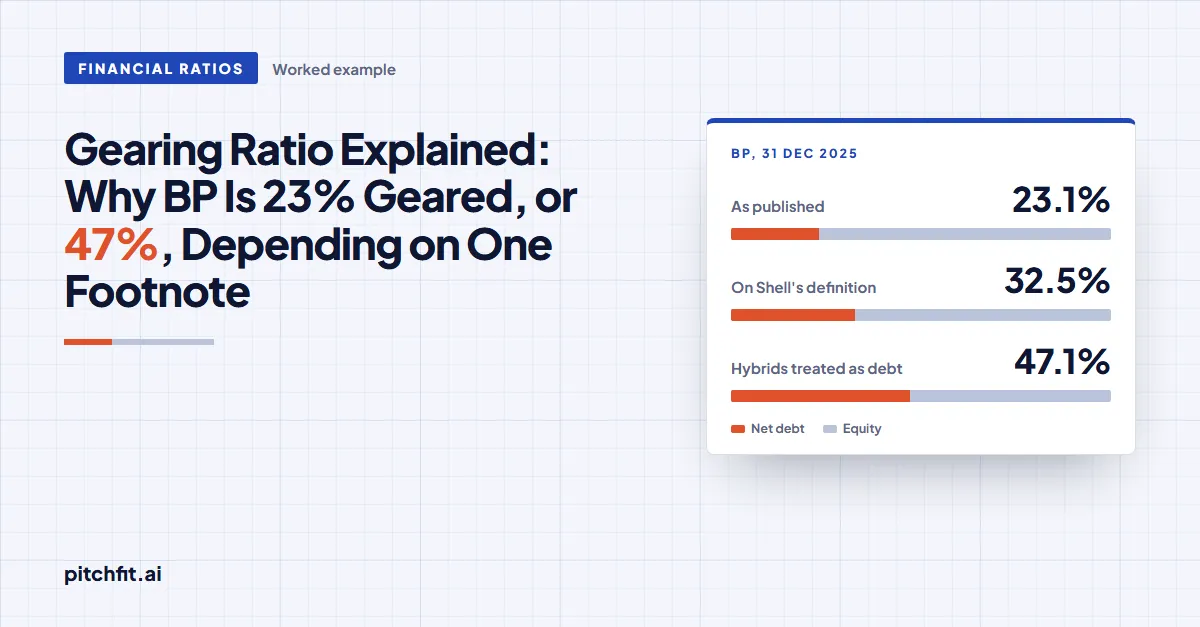
Gearing, one definition
FY2025 · leases in ·Median 19.1%
✓ Traced
13.0%XOM
17.4%CVX
20.7%SHEL
32.5%BP
Join the waitlist
01Insights · the standardization engine

Put any company on the same footing.

Pick the companies. Pick the statements and metrics. Get one standardized, defensible comparison - no more three analysts, three answers.

  • 4 standardized statements - P&L, Balance Sheet, Cash Flow & Changes in Equity, normalized line-for-line.
  • 200+ metrics across Liquidity, Profitability, Leverage & Efficiency - computed the same way every time.
  • Every number traces to source - click any figure back to the filing it came from.
Join the waitlist
Select metrics of interest
ExxonMobil · Chevron · Shell · BP
Gearing
Return on equity
Debt to equity
Current ratio
EBITDA margin
Cashflow coverage
4
Statements
200+
Metrics
100%
Sourced
1
Basis
Askfilings · transcripts · news
Tell me NVO's Ozempic versus LLY's Mounjaro sales for Q4 2025.
In Q4 2025, Ozempic (Novo Nordisk) revenue was ≈ $4.8B, while Eli Lilly's Mounjaro reached ≈ $7.4B - Lilly ahead on the quarter, both standardized to USD.
Ozempic
$4.8B
Mounjaro
$7.4B
NVO 10-K/QLilly 10-K/QEarnings call transcript
Ask anything across filings, transcripts & news
02Ask · answers you can trace

Ask anything. Trust the answer.

Plain-language questions across filings, transcripts and news. Get a sourced answer in seconds - or send the comparison straight to Insights.

  • Any company you care about - "Tell me NVO's Ozempic vs LLY's Mounjaro sales for Q4 2025."
  • Every claim cited - filings, transcripts and news, linked inline. Nothing unsourced.
  • Hand off to Insights - turn any question into a standardized, like-for-like comparison.
Get early access
A worked example · BP

Same company. Same year.
First, or last.

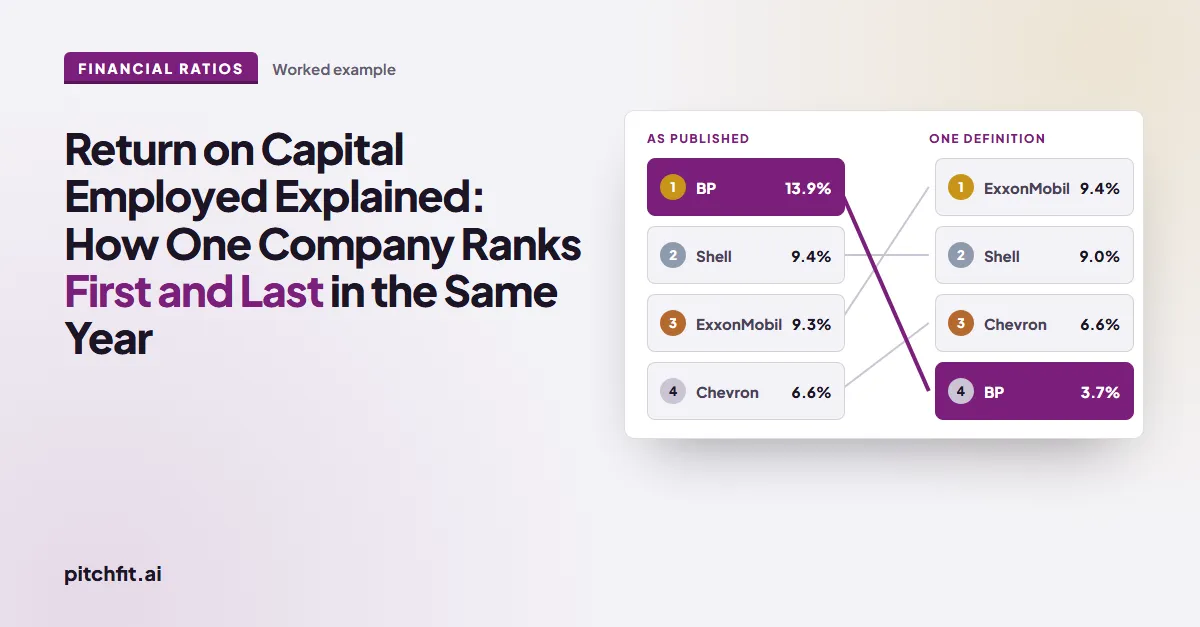
BP’s return on capital, FY2025. Nothing changed but the definition.

Rebase engine·Return on capital employed · 4 oil majorsBP13.9%As reported
AS REPORTEDON ONE BASIS#1#1#2#2#3#3#4#4BP13.9%Shell9.4%ExxonMobil9.3%Chevron6.6%ExxonMobil9.4%Shell9.0%Chevron6.6%BP3.7%−10.2 ptsSame filings. One written definition, applied to all four.AS REPORTEDON ONE BASIS#1#1#2#2#3#3#4#4BP13.9%Shell9.4%ExxonMobil9.3%Chevron6.6%ExxonMobil9.4%Shell9.0%Chevron6.6%BP3.7%−10.2 ptsSame filings. One written definition, applied to all four.AS REPORTEDON ONE BASISBP13.9%Shell9.4%ExxonMobil9.3%Chevron6.6%ExxonMobil9.4%Shell9.0%Chevron6.6%BP3.7%−10.2 pts

Same filings. One written definition, applied to all four.

13.9%BP’s own recipe
−3.6 ptsGoodwill + $14.6bn leases counted as capital
10.3%same profit, one capital base
−6.6 ptsReported profit ($55m), not “underlying” ($7.5bn)
3.7%Rebase basis · last of 4 ✓

Built by Rebase from each company’s FY2025 results and filings.

Why not just CapIQ?

They hand you a number.
Rebase makes it comparable.

Three versions in. One basis out.
YesPartlyNo
RebaseBy analysts
Explains every gap to reportedBP reports 13.9%; on one basis it’s 3.7%. You see both, and why.
Rebase: yes
Capital IQ: no
FactSet: no
Bloomberg: no
AlphaSense: no
Fiscal.ai: no
Daloopa: no
ChatGPT: no
Peers comparable out of the boxNo re-keying terminal data into Excel. 90% of analysts still do.
Rebase: yes
Capital IQ: partly
FactSet: partly
Bloomberg: partly
AlphaSense: partly
Fiscal.ai: partly
Daloopa: partly
ChatGPT: no
Survives “how did you get that?”One basis the whole room shares, every figure traced to the filing.
Rebase: yes
Capital IQ: partly
FactSet: partly
Bloomberg: partly
AlphaSense: partly
Fiscal.ai: partly
Daloopa: partly
ChatGPT: no
Ask anything, get like-for-likeEvery claim cited, then sent straight into a standardized comparison.
Rebase: yes
Capital IQ: partly
FactSet: partly
Bloomberg: partly
AlphaSense: yes
Fiscal.ai: partly
Daloopa: partly
ChatGPT: partly
Priced for one analystBuilt by analysts who paid for the terminals. One seat, no contract.
Rebase: yes
Capital IQ: no
FactSet: no
Bloomberg: no
AlphaSense: no
Fiscal.ai: yes
Daloopa: partly
ChatGPT: yes
Seat cost per yearThird-party estimates
Founding pricing
$15–30k
$12–50k
$28–32k
$10k+
~$0.5–1k
Enterprise
~$240+
Compare with
YesPartlyNo
Rebase
CIQCapital IQ
Explains every gap to reportedBP reports 13.9%; on one basis it’s 3.7%. You see both, and why.
Rebase: yes
Capital IQ: no
Peers comparable out of the boxNo re-keying terminal data into Excel. 90% of analysts still do.
Rebase: yes
Capital IQ: partly
Survives “how did you get that?”One basis the whole room shares, every figure traced to the filing.
Rebase: yes
Capital IQ: partly
Ask anything, get like-for-likeEvery claim cited, then sent straight into a standardized comparison.
Rebase: yes
Capital IQ: partly
Priced for one analystBuilt by analysts who paid for the terminals. One seat, no contract.
Rebase: yes
Capital IQ: no
Seat cost per yearThird-party estimates
Founding pricing
$15–30k
CIQVSCapital IQ is great for global coverageCapital IQ tells you BP’s number. Rebase tells you whether it’s comparable to Shell’s.

Seat costs are third-party estimates (Costbench, published plan prices, PricingSaaS); vendors quote custom prices.

Join the waitlist
Why Rebase

So the C-suite never has to choose which version to believe again.

Rebase replaces that spreadsheet - one basis, every figure traced to source.
YE
Yahya ElAli
Founder
LinkedIn
The problem, quantified
90%
of analysts still rebuild statements by hand in Excel - re-keying from CapIQ, Bloomberg, FactSet and raw filings.
Survey of 500+ finance professionals · Rebase market research, 2026
“Why Rebase

So the C-suite never has to choose which version to believe again.

We know the pain-points the C-suite faces - because the founding team has lived them. Our Founder advised on major restructuring and transformation programs before building Rebase to end the "three answers" problem for good.

Rebase replaces that spreadsheet - one basis, every figure traced to source.

YE
Yahya ElAliFounder
LinkedIn
The problem, quantified
90%

of analysts still rebuild statements by hand in Excel - re-keying from CapIQ, Bloomberg, FactSet and raw filings just to read them the same way.

1 in 2

say the same line item is classified differently from one company to the next.

~50%

cite calendarisation - aligning fiscal-year mismatches - as a comparison pain-point.

Survey of 500+ finance professionals; Rebase market research, 2026

Pricing

Start with one seat.
Scale to every team.

For Individuals
Any company on the same footing, every figure traced to its filing.
  • Statements and metrics - Standardized numbers, traced to source
  • No hallucination - Facts reported and linked, with direct source access
  • Storage - Every comparison and answer, kept in one place
  • Collaboration - Work with colleagues on a single analysis or research anytime
Join the waitlist
Enterprise · Custom

For Individuals

Any company on the same footing, every figure traced to its filing.

For Enterprise

The whole strategy, commercial and FP&A teams, on one basis.

  • Statements and metricsStandardized numbers, tracedto source
  • No hallucinationFacts reported and linked, with direct source access
  • StorageEvery comparison and answer, kept in one place
  • CollaborationWork with colleagues on a single analysis or research anytime
Join the waitlist
FAQ

Questions, answered.

FAQ

Questions, answered.

Everything about the standardization basis, sourcing, coverage and getting early access.

We normalize every company's statements onto a single, consistent set of line items and definitions. So when you compare net margin or a liquidity ratio across companies, the numbers are computed the same way - no reconciliation, no guesswork about how each was standardized.

Ask answers plain-language questions across filings, transcripts and news with cited sources. Insights is the standardization engine that puts companies side by side on the same basis. Ask any question, then hand it to Insights for a like-for-like comparison.

Every figure traces back to the filing it came from. Click any number to see the source line, statement and period. Ask cites filings, transcripts and news inline - nothing is presented unsourced.

Those are data warehouses - they give you raw numbers. Rebase is a standardization layer on top: every line item is mapped to the same definition across every company, so comparisons are like-for-like by default. Think of it as the translation engine that makes CapIQ data actually comparable.

We're aiming to launch in roughly 27 days. Waitlist members get first access, founding-member pricing locked for life, and a direct line to the team while we ship.

Rebase
Launching in 27 days

Stop choosing which numbers to believe.

Early access · No spam

Join the waitlist for first access, and lock founding-member pricing for life.

For the C-suite, analysts and finance teams. No spam - one email at launch.

Teams: paste several emails, comma-separated.

Add up to 100 emails, separated by commas.