Return on Capital Employed Explained: How One Company Ranks First and Last in the Same Year
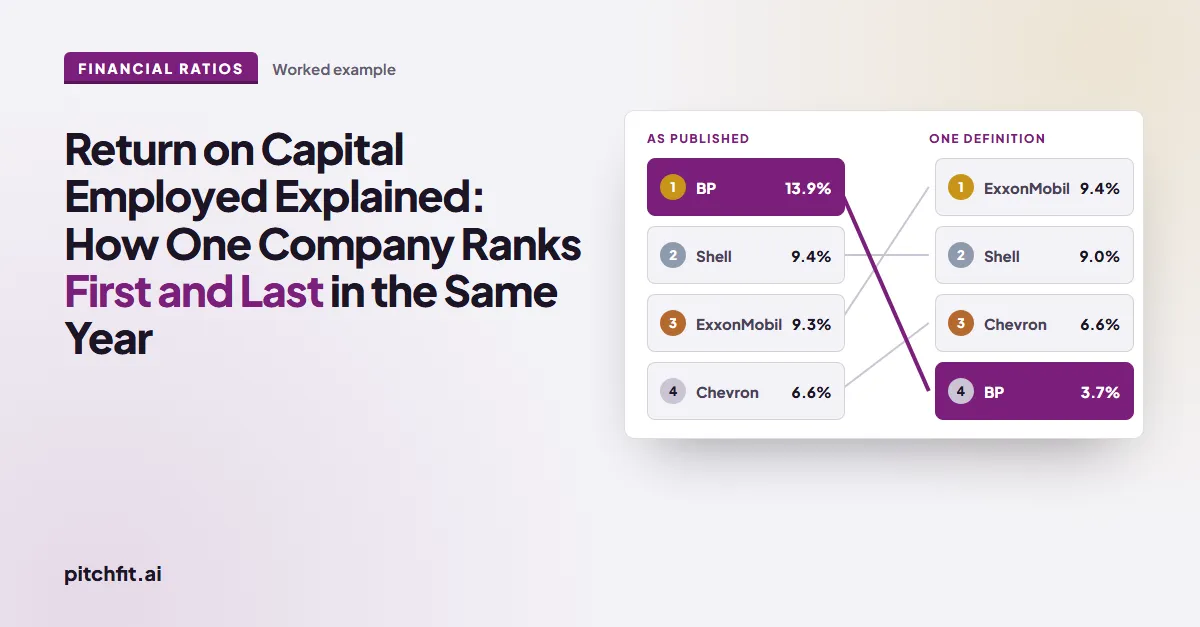
BP published the best 2025 ROCE of the four oil majors, 13.9%. On reported profit and one capital base it is 3.7%, the lowest. What changes, and why.
If you read nothing else
- BP published the best return on capital employed of the four Western oil majors for 2025: 13.9%. On the profit BP actually reported, with everyone's capital measured the same way, it is 3.7%, the worst of the four.
- The gap is not performance. It is four companies answering three questions four different ways: which profit, which capital, which dates.
- Rebase rebuilds ROCE for every company on one definition, so a ranking means what it looks like it means.
| FY2025 | ROCE as published | ROCE, one definition, reported profit | ROCE, one definition, adjusted profit |
|---|---|---|---|
| ExxonMobil | 9.3% | 9.4% | 9.4% |
| Shell | 9.4% | 9.0% | 9.3% |
| Chevron | 6.6% | 6.6% | 6.6% |
| BP | 13.9% | 3.7% | 10.3% |
How we calculated this
One definition means the same three rules for all four companies:
- Profit on top: the profit the company reported, plus the share belonging to minority shareholders, plus after-tax finance cost. The company's own adjusted profit is shown beside it, never as the headline.
- Capital underneath: total equity (minority interests included) + borrowings + lease liabilities − cash, deposits and marketable securities. Leases in, goodwill in, cash out, for everyone.
- Dates: the average of the 31 December 2024 and 31 December 2025 balance sheets, taken from each company's filings.
| USD million | Capital employed, 31 Dec 2024 | 31 Dec 2025 | Average used |
|---|---|---|---|
| ExxonMobil | 295,765 | 306,316 | 301,041 |
| Shell | 218,979 | 221,006 | 219,993 |
| Chevron | 175,951 | 232,622 | 204,287 |
| BP | 113,315 | 109,686 | 111,501 |
Reported-profit numerators: ExxonMobil 28,297; Shell 19,840; Chevron 13,581; BP 4,095. These are the Rebase standard definitions used in every ratio we publish.
What does ROCE measure?
For every dollar invested in the business, how many cents of operating profit came back. It is the measure boards use to judge whether a capital-heavy company earns more than its capital costs; Shell's target is at least 10%. The formula is simple (profit from operations over the capital that produced it), and everything that follows is about what each company chose to put in each half.
Which profit goes on top?
Two of the four use a cleaned-up profit; two use the profit they reported.
BP starts from "underlying replacement cost profit": 7.5 billion dollars, after removing 6.4 billion of adjusting items and 1.0 billion of inventory losses. Its reported profit for the year was 55 million. Shell starts from "adjusted earnings", but its one-off items netted to only 53 million, so adjusted and reported are almost the same number. ExxonMobil and Chevron use what they reported and remove nothing.
Put reported profit into every numerator, change nothing else, and BP moves from first to last on that one decision.
Building a peer set this quarter? Rebase shows every company's ROCE on reported and adjusted profit side by side, with the adjustments quantified. Join the waitlist.
Which capital goes underneath?
Here the choices pull the same way.
- BP takes out goodwill and leaves out 14.6 billion of lease liabilities. Both shrink the base, and a smaller base means a higher return.
- Shell keeps goodwill and counts leases as debt.
- Exxon and Chevron keep goodwill and do not deduct cash, which makes their base larger and their return lower.
- Chevron's average also carries half a year of Hess capital against a part-year of Hess earnings, after the acquisition closed mid-year.
Rebuilt on one rule (total equity including minorities, plus debt, plus lease liabilities, less cash, averaged across the two year-ends), BP's capital base rises from its own 83 billion to 111 billion. Shell's barely moves, because Shell already measures it this way. Exxon's and Chevron's fall a little once cash comes out.
(The year-end inputs are in the box under the first table.)
So who actually earned the most on its capital?
On reported profit and one capital base: Exxon, Shell, Chevron, BP. On adjusted profit and one capital base: BP, Exxon, Shell, Chevron, but BP's lead over Exxon shrinks from four and a half points to under one. Whichever profit you prefer, the published table overstates the spread between the leader and the rest by a wide margin.
Neither Shell's release nor BP's answers these questions for the other company. A table that lifts four published figures into one column has not answered them for anyone.
How does Rebase do this?
It maps every income statement and balance sheet, IFRS or US GAAP, to one canonical template and rebuilds both halves of the ratio from the same lines:
- Profit: reported profit plus minority interests plus after-tax finance costs is the headline; the adjusted figure sits beside it with each adjustment listed.
- Capital: total equity plus borrowings plus lease liabilities, less cash and marketable securities: leases in, goodwill in, cash out, for everyone.
- Dates: the average of opening and closing balance sheets from the filings themselves, with mid-year acquisitions flagged.
- Trace: every figure points back to the printed line it came from, so any treatment can be checked and reversed.
Return on capital employed is the right measure for this industry. It is only a comparable one when the four fractions are built from the same lines.
Get the four majors, or your own peer set, on one definition. Join the Rebase waitlist; early members get their first comparison built with us.
Frequently asked questions
What is a good return on capital employed?
A return above the company's cost of capital, typically 8% to 10% for an oil major, creates value; below it, value is destroyed however large the profit. Shell's own target of at least 10% is a useful sector benchmark.
How is ROCE different from return on equity?
Return on equity measures profit against shareholders' money only. ROCE measures profit before interest against all capital, debt as well as equity, so it is not flattered by borrowing.
Why do companies adjust the profit they use?
To remove items they regard as one-off (impairments, disposal gains, inventory revaluations), so the ratio reflects the underlying business. The adjustments are legitimate but they are the company's own choice, and in a year like BP's 2025 they are the whole story.
Should cash be deducted from capital employed?
Most analysts deduct it, because cash in the bank is not capital at work in the business. Exxon and Chevron leave it in; Shell and BP take it out. On one rule the difference disappears.
Can ROCE be compared between IFRS and US GAAP companies?
Only after both are rebuilt on one definition. Lease accounting, goodwill treatment and company-specific adjustments differ by framework and by company.
Sources: Shell plc, fourth quarter and full year 2025 unaudited results, ROACE reference note; bp p.l.c., fourth quarter and full year 2025 results, ROACE reconciliation and net debt note; ExxonMobil, 2025 results, return on average capital employed schedule; Chevron, fourth quarter 2025 results, ROCE and capital employed data. Reported-profit numerators for Shell and BP computed by removing each company's disclosed adjustments from its published numerator. One-definition capital employed built from year-end balance sheets in the FY2024 and FY2025 Forms 10-K (ExxonMobil, Chevron) and 20-F (Shell, bp): total equity including minority interests, plus total debt, plus lease liabilities, less cash, cash equivalents, time deposits and marketable securities.
Advised on major restructuring and transformation programs at Oliver Wyman before building Rebase to end the "three answers" problem for good.
 Restructuring
 Financial ratios
 Financial ratios
 IFRS 18 Watch
 IFRS 18 WatchRestructuringFinancial ratiosFinancial ratiosIFRS 18 WatchIFRS 18 Watch