Comparable Company Analysis: Walmart, Target and Costco
A comps table for Walmart, Target and Costco from SEC filings: aligned trailing periods, one EBITDA definition and an adjustment ledger a reviewer can check.
Walmart, Target and Costco make a useful test of a comps table. They sell overlapping products, but their business models, reporting calendars and presentation of unusual items differ.
Those differences change the comparison. Using each company's latest annual report, Target's EBITDA margin leads Walmart's by 1.70 percentage points. Updating Walmart and Target to trailing periods ending close to Costco's year end widens that gap to 2.10 points. Deciding how to adjust unusual items requires another layer of evidence.
Here is how to build that comparison from the SEC filings, and how to show what the numbers do and do not establish.
Data checked against filings available on 29 October 2026. Dollar amounts are USD millions unless stated. EBITDA in this example is an analyst calculation: reported operating income plus the depreciation and amortization shown in the cash-flow statement. It is not presented as a company-reported or fully normalized measure.
What is comparable company analysis?
Comparable company analysis, or "comps," compares similar listed companies using measures such as revenue growth, margins, returns and valuation multiples. A valuation may apply peers' enterprise-value-to-EBITDA or price-to-earnings multiples to the company being assessed.
The work starts before calculating a multiple: choosing relevant peers, aligning the reporting periods and establishing consistent definitions. This example focuses on that financial comparison; it does not calculate market-based valuation multiples for the three companies.
Step 1:Choose peers and identify the differences
Walmart, Target and Costco overlap in groceries and general merchandise, stores and online sales. They are useful retail comparators, but a margin difference does not automatically mean one company operates better.
Costco's membership model is particularly important. In fiscal 2026, it reported membership-fee revenue of $5,907 million and operating income of $11,685 million. Membership fees are therefore equivalent to approximately half of operating income. That is a comparison of two reported amounts, not proof that membership fees generate half its operating profit: the filing does not allocate all associated costs to that revenue stream.[1]
Geography, product mix, fuel sales, advertising and membership revenue also affect the comparison. Record those differences alongside the financial table.
Step 2:Bring the reporting periods closer together
The latest annual reports cover different year ends. Walmart and Target finish in January; Costco finishes in August.
For Walmart and Target, update the annual figures using:
| Company | Latest annual year end | Period used in the updated comparison |
|---|---|---|
| Walmart | 31 January 2026 | 12 months ended 31 July 2026 |
| Target | 31 January 2026 | 52 weeks ended 1 August 2026 |
| Costco | 30 August 2026 | 52 weeks ended 30 August 2026 |
This substantially reduces the timing difference, but does not produce identical dates. Costco still ends 29 days after Target and 30 days after Walmart. Call these closely aligned trailing periods, rather than exactly the same twelve months. Exact calendarization to a common date would require finer-period information or clearly labelled estimates.
For Walmart, the calculation is:[2][3]
| Revenue | Operating income | Depreciation and amortization | |
|---|---|---|---|
| Fiscal year ended 31 January 2026 | 713,163 | 29,825 | 14,203 |
| Plus six months ended 31 July 2026 | 365,688 | 16,876 | 7,746 |
| Less six months ended 31 July 2025 | (343,011) | (14,421) | (6,856) |
| Trailing 12 months ended 31 July 2026 | 735,840 | 32,280 | 15,093 |
Walmart separately reports trailing D&A of $15,094 million in its return-on-investment reconciliation. The $1 million difference arises when rebuilding the measure from the rounded annual and interim amounts. This example consistently uses the reconstructed $15,093 million; the difference does not affect the margins rounded below.
Target's equivalent calculation is:[4][5]
| Revenue | Operating income | Depreciation and amortization | |
|---|---|---|---|
| Fiscal year ended 31 January 2026 | 104,780 | 5,117 | 3,134 |
| Plus six months ended 1 August 2026 | 51,982 | 3,695 | 1,597 |
| Less six months ended 2 August 2025 | (49,057) | (2,789) | (1,558) |
| Trailing 52 weeks ended 1 August 2026 | 107,705 | 6,023 | 3,173 |
Costco's annual figures are revenue of $303,154 million, operating income of $11,685 million and D&A of $2,674 million.[1]
Using the same EBITDA definition gives:
| Walmart | Target | Costco | |
|---|---|---|---|
| Calculated EBITDA: latest annual period | 44,028 | 8,251 | 14,359 |
| Calculated EBITDA: closely aligned trailing period | 47,373 | 9,196 | 14,359 |
| EBITDA margin: latest annual report | 6.17% | 7.87% | 4.74% |
| EBITDA margin: closely aligned trailing period | 6.44% | 8.54% | 4.74% |
The updated EBITDA amounts are 7.6% higher for Walmart and 11.5% higher for Target than their January annual figures. These are changes between reporting windows, not growth caused by the calculation itself.
Step 3:Build an adjustment ledger before adjusting earnings
A company's own "adjusted" result is useful evidence, but it does not establish a consistent policy across peers. Record each potential adjustment, where it appears in the accounts, and whether its effect is sufficiently quantified.
The tariff refunds illustrate why the full filings matter:
| Company | What the filing establishes | Implication for this comparison |
|---|---|---|
| Walmart | Approximately $2,900 million of refunds reduced cost of sales. A significant portion funded customer initiatives, principally price investment and other cost mitigation. | The gross refund is quantified. Its net earnings benefit after those initiatives is not separately quantified. |
| Target | $994 million of refunds reduced cost of sales in the second quarter of fiscal 2026, ended 1 August 2026. The benefit remains in the company's adjusted results. | A tariff-only scenario can remove the disclosed $994 million benefit. It is not a complete normalization of all unusual items. |
| Costco | $184 million received: $174 million reduced merchandise costs and $10 million was interest income. Some refunds funded lower member prices. | The $174 million operating credit is relevant to operating-income-based EBITDA. The $10 million interest income is already outside it. |
Sources: Walmart's July 2026 10-Q, Target's August 2026 10-Q and Costco's fiscal 2026 10-K.[3][5][1]
Gross refunds and the benefit retained after price reductions are different measures. Removing the gross refund while retaining the associated price-investment costs answers a different question from estimating earnings without either effect. Show the chosen treatment explicitly.
There are other candidate adjustments too:
- Walmart: its disclosed operating-income adjustments produce a net $748 million expense add-back over the reconstructed trailing period, as reconciled below. These are management-defined adjustments, not automatic evidence that every amount should be excluded from a peer comparison.[6][7]
- Target: fiscal 2025 (year ended 31 January 2026) includes $250 million of business-transformation costs: $129 million of severance, $57 million of lease-termination costs and $64 million of impairment and other costs. Target names this year for the calendar year in which it begins; Walmart calls the year ending on the same date fiscal 2026. These costs must be considered when reviewing the trailing-period adjustments. A policy addressing Walmart's reorganization costs must also assess Target's, including the relevant period and any overlap with amounts already added back in D&A.[4][5]
- Target's earlier settlement: the $593 million interchange-litigation gain is included in both the annual figure and the prior-year first half, so it cancels out of the trailing calculation.[5]
Walmart's $748 million bridge follows the same annual-plus-current-YTD-minus-prior-YTD method:[6][7]
| Bridge period | Disclosed operating-income adjustments | USD million |
|---|---|---|
| Fiscal 2026, ended 31 January 2026 | PhonePe incremental share-based compensation 722 + legal matters 285 + reorganization 150 | 1,157 |
| Plus first half of fiscal 2027, ended 31 July 2026 | Reorganization 181 | 181 |
| Less first half of fiscal 2026, ended 31 July 2025 | Legal matters 440 + reorganization 150 | (590) |
| Net trailing-period adjustment | 1,157 + 181 − 590 | 748 |
For example, removing only Target's tariff refund gives $9,196m − $994m = $8,202m, or a 7.62% margin. Label that a tariff-only adjustment. It does not resolve the transformation costs or establish fully normalized EBITDA.
For each proposed adjustment, check that it belongs to the selected period, affects the earnings measure being used, and has not already been removed or added back. Keep estimates separate from disclosed amounts. An after-tax EPS effect cannot be deducted directly from pre-tax EBITDA.
Step 4:Calculate ratios using the stated definitions
Revenue and D&A need as much attention as unusual items.
Read what revenue includes. Walmart's total revenue includes membership and other income. Costco's combines net sales and membership fees. Target calls its total "Net Sales," but that figure already includes advertising, membership and other non-merchandise revenue. A matching caption is not enough; neither is a different caption proof of a different definition.[1][2][5]
Check the complete D&A amount. Target's fiscal 2025 cash-flow statement (year ended 31 January 2026) reports $3,134 million, compared with $2,617 million in the separate income-statement D&A line. Using that income-statement line alone would omit $517 million, including depreciation within cost of sales.[4]
The cash-flow reconciliation is a useful source, but its contents still need checking. Do not automatically treat every noncash adjustment as depreciation or add an amount back twice.
For valuation multiples, use enterprise values measured on the same date, consistent debt and cash definitions, and earnings with the same treatment of adjustments and leases. Holding enterprise value constant, increasing EBITDA lowers EV/EBITDA mathematically. That alone does not establish that a company is undervalued.
Step 5:Make the table reviewable
Keep four things with the finished comparison:
- Source amounts: the filed figures, their periods and units.
- Calculations: the annual and interim bridge used to construct each trailing period.
- Adjustments: the amount, source, treatment and any unresolved limitation.
- Comparability notes: remaining differences in dates, business model and accounting presentation.
The result is a table a reviewer can reproduce, with judgments visible rather than hidden inside a single "cleaned" number.
What we are building with Rebase
We are building Rebase to make financial comparisons traceable, from the filed statement to the comparison table.
Our current work focuses on consistent financial definitions, period alignment, preserving source evidence, and separating reported results from analytical adjustments. We are validating the mapping and calculation rules against actual filings, including checks for missing components, double counting and mismatched periods or ownership scopes.
The aim is to show what each number includes, how it was calculated, and where judgment or incomplete disclosure still affects the comparison. That is the approach illustrated by the worked example above.
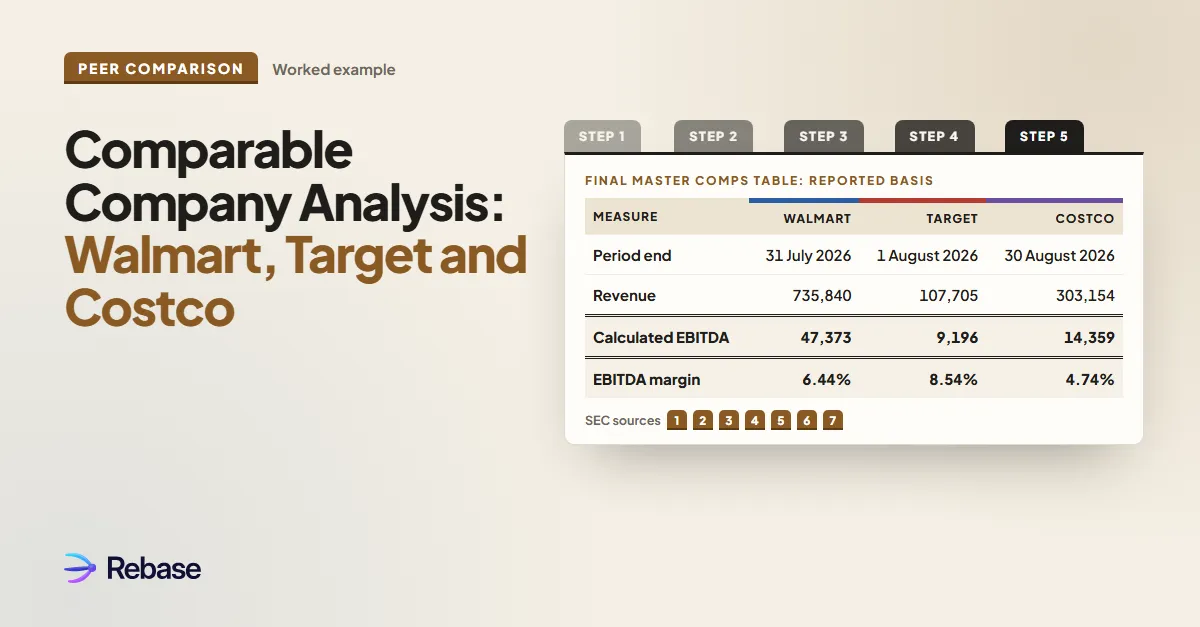
Final master comps table: reported basis
The figures, periods and open adjustment questions come together in one reviewable view. Amounts are USD millions; EBITDA is calculated as operating income plus D&A, with no analytical adjustments applied in this table.
| Measure | Walmart | Target | Costco |
|---|---|---|---|
| Period end | 31 July 2026 | 1 August 2026 | 30 August 2026 |
| Period length | 12 months | 52 weeks | 52 weeks |
| Revenue | 735,840 | 107,705 | 303,154 |
| Operating income | 32,280 | 6,023 | 11,685 |
| D&A | 15,093 | 3,173 | 2,674 |
| Calculated EBITDA | 47,373 | 9,196 | 14,359 |
| EBITDA margin | 6.44% | 8.54% | 4.74% |
| Adjustment questions retained for review | Refund/reinvestment effect; management expense adjustments | Tariff refund; transformation costs and possible D&A overlap | Operating refund versus price reinvestment; interest income kept separate |
| SEC sources | Annual · Interim | Annual · Interim | Annual |
The periods are closely aligned, not identical. Walmart's reconstructed D&A uses the rounded-input basis explained in Step 2. The separate tariff-only example in Step 3 is an analytical scenario and is not substituted into this reported-basis table.
Join the Rebase waitlist for product updates and early access.
Frequently asked questions
How do you choose comparable companies?
Start with business model, products, customers, geography and scale. Explain material differences rather than assuming that companies in the same sector are interchangeable.
What does calendarization mean?
Aligning financial results to a common reporting period. Annual-plus-current-YTD-minus-prior-YTD calculations produce updated trailing periods. When their end dates still differ, disclose the remaining gap instead of calling them identical periods.
Should all one-off items be removed?
Use an explicit policy applied consistently across peers. Assess the economics, period and accounting treatment of each item. A company label such as "adjusted" or "noncash" is not enough, and an unquantified effect should remain visible as a limitation.
Which valuation multiple should you use?
Choose a measure suited to the business and purpose. EV/EBITDA and price-to-earnings are common starting points, but neither eliminates differences in capital intensity, leases, growth or risk.
SEC sources
- [1] Costco FY2026 Form 10-K, year ended 30 August 2026: financial statements; membership fees; tariff impacts and gross-margin discussion. Accession 0000909832-26-000093.
- [2] Walmart FY2026 Form 10-K, year ended 31 January 2026: statements of income and cash flows. Accession 0000104169-26-000055.
- [3] Walmart Q2 FY2027 Form 10-Q, period ended 31 July 2026: interim statements; Note 5 gain contingencies; tariff discussion; return-on-investment reconciliation. Accession 0000104169-26-000154.
- [4] Target FY2025 Form 10-K, year ended 31 January 2026: statements of operations and cash flows; Note 7 transformation costs; Note 12 property and equipment. Accession 0000027419-26-000016.
- [5] Target Q2 FY2026 Form 10-Q, period ended 1 August 2026: interim statements; tariff refunds; interchange settlements; transformation discussion. Accession 0000027419-26-000042.
- [6] Walmart FY2026 earnings release, filed with the SEC: adjusted operating-income reconciliation. Accession 0000104169-26-000032.
- [7] Walmart Q2 FY2027 earnings release, filed with the SEC: current and comparative adjusted operating-income reconciliation. Accession 0000104169-26-000145.
 Restructuring
 Insights
 Insights
 Industry benchmarks
 Financial ratiosRestructuringInsightsInsightsIndustry benchmarksFinancial ratios