What Is a Good EBITDA Margin?Benchmarks for 23 Industries, and Four Traps Before You Compare Yours
The average US listed company has a 16.6% EBITDA margin; by industry it runs from 3.9% to 35.9%. Benchmarks for 23 industries, and four traps.
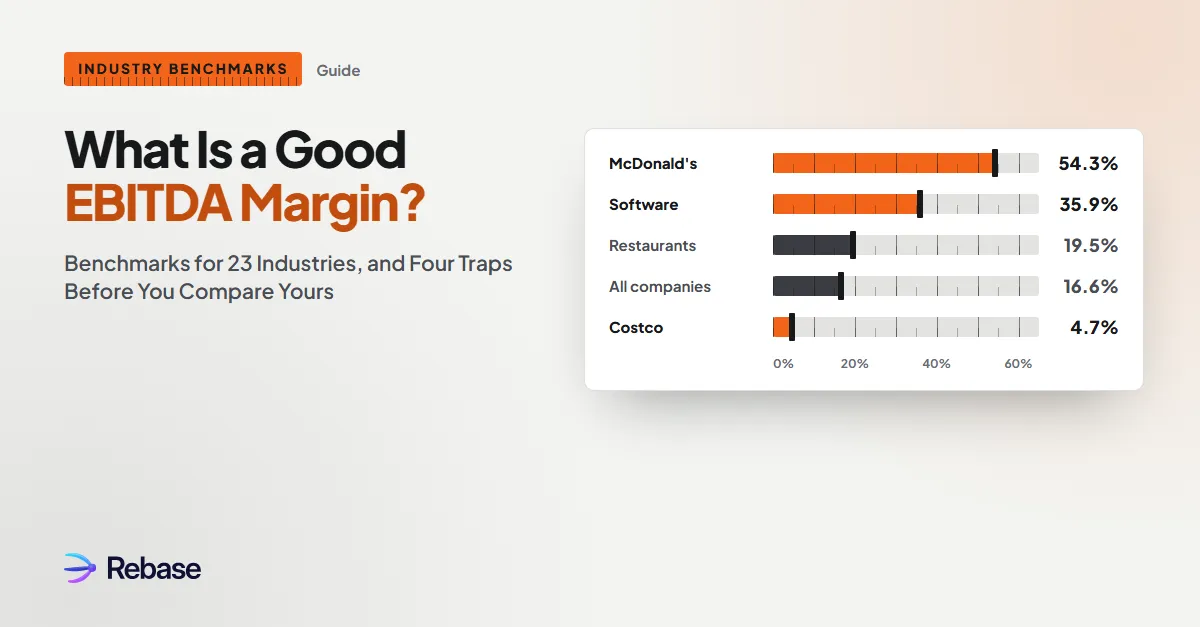
Across 5,994 US listed companies, the average EBITDA margin is 16.6%. By industry it runs from 3.9% in healthcare support services to 35.9% in software. Whether your margin is good depends less on that table than on whether you are comparing yourself with businesses built the same way.
EBITDA margin by industry, 2026
EBITDA as a share of revenue, US listed companies, from Professor Aswath Damodaran's January 2026 dataset at NYU Stern. The averages are weighted toward the largest companies in each industry.
| Industry | EBITDA margin | Companies |
|---|---|---|
| Software (system and application) | 35.9% | 309 |
| Telecom services | 34.7% | 39 |
| Hotels and gaming | 24.5% | 63 |
| Soft drinks | 22.8% | 27 |
| Machinery | 19.6% | 105 |
| Restaurants | 19.5% | 64 |
| Construction supplies | 19.5% | 40 |
| Building materials | 17.3% | 41 |
| Information services | 17.3% | 15 |
| Business and consumer services | 15.7% | 155 |
| Trucking | 15.6% | 26 |
| Food processing | 15.3% | 78 |
| Homebuilding | 14.1% | 30 |
| Advertising | 14.1% | 52 |
| Apparel | 11.5% | 35 |
| Airlines | 10.3% | 23 |
| General retail | 10.1% | 23 |
| Transportation | 9.8% | 19 |
| Auto parts | 9.0% | 35 |
| IT and computer services | 9.0% | 64 |
| Engineering and construction | 8.0% | 48 |
| Grocery retail | 5.4% | 15 |
| Healthcare support services | 3.9% | 104 |
| All companies | 16.6% | 5,994 |
A margin near your industry's figure tells you that you are in the normal range for listed companies in that industry. It does not tell you whether your business is well run, because the industry figure blends very different business models. The four traps below show how far apart two companies in the same row can be, using each company's 2025 filed accounts.
Trap 1: Same industry, different business model
McDonald's and Chipotle both sit in the restaurant row. Their 2025 EBITDA margins are 54.3% and 19.3%.
| 2025, USD million | Revenue | Operating income | Depreciation and amortization | EBITDA margin |
|---|---|---|---|---|
| McDonald's | 26,885 | 12,393 | 2,199 | 54.3% |
| Chipotle | 11,926 | 1,936 | 361 | 19.3% |
About 95% of McDonald's restaurants are run by franchisees. Most of its revenue is rent and royalties from them, and the franchisees carry the food, staff and running costs. Chipotle runs almost all of its restaurants itself, so every cost of every restaurant is in its accounts. Chipotle sits almost exactly on the industry figure of 19.5%. McDonald's is nearly three times it.
A restaurant owner with 18% is on par with Chipotle. Measured against McDonald's, the same owner looks like a failing business. Compare yourself with listed companies that run the model you run.
Trap 2: What counts as revenue
Marriott's 2025 EBITDA margin is 16.6% on its reported revenue of 26.2 billion dollars. But 19.2 billion of that revenue is "cost reimbursement": hotel owners repaying Marriott for staff and costs it pays on their behalf, with almost no profit attached. Take it out and Marriott's margin on the revenue it actually earns is 62.4%.
The same issue affects any business that passes costs through to customers: agencies that buy media for clients, contractors that rebill materials, staffing firms that pay workers on a client's behalf. If you report revenue net and your peer reports it gross, or the other way round, the margins cannot be compared until one of them is restated.
Trap 3: Businesses inside the business
Delta's 2025 EBITDA margin is 13.0%, against 10.3% for airlines overall. Its revenue includes 5.1 billion dollars of fuel sold to third parties by the refinery it owns. Remove the refinery sales and the margin is 14.2%.
Delta's accounts also show the lease question every comparison has to answer. Under US accounting rules, Delta's 542 million of aircraft rent is an operating cost, so it reduces EBITDA. A European airline reporting under IFRS would show the same rent as depreciation and interest, both of which sit outside EBITDA. Most small businesses expense their rent, which puts them in Delta's position, not the European airline's. Before you compare yourself with a listed company, check whether its EBITDA is before or after rent.
Trap 4: Thin margins by design
Costco's 2025 EBITDA margin is 4.7%, less than half the general retail average of 10.1% and below grocery retail's 5.4%. That is the business model working as intended. Costco keeps its markups low and earns 5.3 billion dollars from membership fees, equal to about half its operating income.
A low margin on high volume can be a stronger business than a high margin on low volume. A margin always needs to be read beside how fast the business turns its revenue into cash, and how much capital it ties up to do it.
Want to see where your margin sits? Rebase places a private company's accounts next to named listed peers on one definition: same revenue basis, same treatment of rent and one-offs. Join the waitlist. Early members get their first comparison built with us.
How to compare your own margin
Four adjustments get a private company's EBITDA onto the same footing as a listed peer's.
- Owner pay at market rate. If you pay yourself less than a manager would cost, your EBITDA is overstated. If you pay yourself more, it is understated. Listed companies pay market salaries.
- One-offs out. A legal settlement, a relocation, a large bad debt. Take out what will not recur, and only that.
- Rent treated the same way. Find out whether your peer's EBITDA is before or after rent. Restate yours, or theirs, to match.
- Revenue on the same basis. Net out pass-through costs, or gross them up, so both revenue figures measure the same thing.
Then compare against two or three listed companies with your business model, not only against the industry average.
How does Rebase do this?
- Every company's income statement, listed or private, is mapped to one template, so revenue, rent, depreciation and one-offs sit on the same lines.
- Pass-through revenue and businesses inside the business are shown separately, so they can be excluded on one rule.
- Rent is shown both ways, as an operating cost and as a lease, so the comparison matches the peer's accounting.
- Every figure links back to the line in the filing or the accounts it came from.
Benchmark your business against the companies you actually compete with. Join the Rebase waitlist.
Frequently asked questions
What is a good EBITDA margin?
For the average US listed company it is about 16.6%. A good margin is one at or above companies with your business model in your industry: around 19% for a restaurant operator, 10% for an airline, 36% for software.
How do you calculate EBITDA margin?
EBITDA divided by revenue. EBITDA is operating profit with depreciation and amortization added back. For McDonald's in 2025: 12,393 plus 2,199, divided by 26,885, gives 54.3%.
What is the difference between EBITDA margin and operating margin?
Operating margin is after depreciation and amortization; EBITDA margin is before it. The gap is widest in capital-heavy industries such as telecoms and trucking.
Is a 10% EBITDA margin good?
In airlines, general retail or transportation, it is about average. In software or hotels, it is well below average.
Why do small businesses have different margins from listed companies?
Mainly owner pay, rent treatment and scale. Adjust for the first two before comparing; the third is a real difference.
Sources: Aswath Damodaran, Margins by Sector (US), January 2026 update, NYU Stern (EBITDA/Sales by industry). McDonald's Corporation, fourth quarter and full year 2025 results, and cash flow statement depreciation and amortization; Chipotle Mexican Grill, fourth quarter and full year 2025 results; Marriott International, fourth quarter and full year 2025 results; Delta Air Lines, December quarter and full year 2025 results; Costco Wholesale, fiscal year 2025 results (year ended 31 August 2025). EBITDA computed as operating income plus depreciation and amortization from each company's filed figures.
 Restructuring
 Peer comparison
 Financial ratios
 Financial ratios
 IFRS 18 WatchRestructuringPeer comparisonFinancial ratiosFinancial ratiosIFRS 18 Watch