How to Benchmark Your Business Against Public Companies: A Worked Example for Contractors
Three listed US contractors each brought in about $400,000 per employee in 2025, yet kept 6 to 16 cents of EBITDA per dollar. Five numbers to compare yours.
Founder's Benchmark, part 2
EMCOR, Comfort Systems USA and MYR Group each brought in about $400,000 of revenue per employee in 2025. Comfort Systems kept 16 cents of EBITDA from every dollar of it; MYR Group kept 6. For a contractor setting its own business against listed peers, the space between those two facts is the whole exercise.
Five numbers from three listed contractors
All figures for 2025, from each company's annual results and Form 10-K. One-off gains are removed so the three are on the same footing.
| 2025 | EMCOR | Comfort Systems | MYR Group |
|---|---|---|---|
| Main work | Mechanical, electrical and building services | Mainly mechanical: heating, cooling, plumbing | Electrical: power lines and commercial |
| Revenue, USD million | 16,986 | 9,102 | 3,658 |
| Employees at year end | about 44,000 | about 22,700 | about 9,000 |
| Revenue per employee, USD | 386,000 | 401,000 | 406,000 |
| Gross margin | 19.3% | 24.1% | 11.6% |
| Overheads (SG&A) as % of revenue | 10.0% | 9.7% | 7.0% |
| EBITDA margin | 10.5% | 16.0% | 6.2% |
| Days to get paid, net of customer advances | 48 | 27 | 54 |
| Backlog, in years of revenue | 0.8 | 1.3 | 0.8 |
Revenue per employee is almost identical across the three. Everything that separates them happens after the revenue comes in: how the work is priced, what it costs to deliver, and how fast the cash arrives.
Step 1:Pick the company that does your work
Do not average the three. A heating and plumbing contractor should set itself against Comfort Systems. An electrical contractor building power lines belongs next to MYR Group. A firm mixing installation with maintenance contracts sits closer to EMCOR.
The gross margins show why. Comfort Systems earned 24.1% on its work in 2025; MYR Group earned 11.6%. A power-line contractor at 13% is ahead of its listed peer. Set against Comfort Systems, the same business looks like it is losing jobs on price.
Step 2:Calculate your five numbers the same way
Each one can be taken from your own year-end accounts and payroll.
- Revenue per employee: annual revenue divided by headcount at year end, including site crews.
- Gross margin: revenue less direct job costs (labor on site, materials, subcontractors, equipment), divided by revenue.
- Overheads: office salaries, rent, insurance, vehicles not charged to jobs and other running costs, divided by revenue. The listed companies call this SG&A.
- EBITDA margin: gross profit less overheads, with all depreciation and amortization (both job-site equipment and office) added back, divided by revenue.
- Days to get paid, net: money owed to you (invoiced and earned but not yet invoiced), less money customers have paid you in advance, divided by revenue, times 365.
Step 3:Clean both sides before comparing
The listed companies' own figures need cleaning too. EMCOR's 2025 operating income included a $145 million gain on selling its UK business, which is excluded from the table above. Comfort Systems and MYR Group both booked small gains on selling equipment, also excluded.
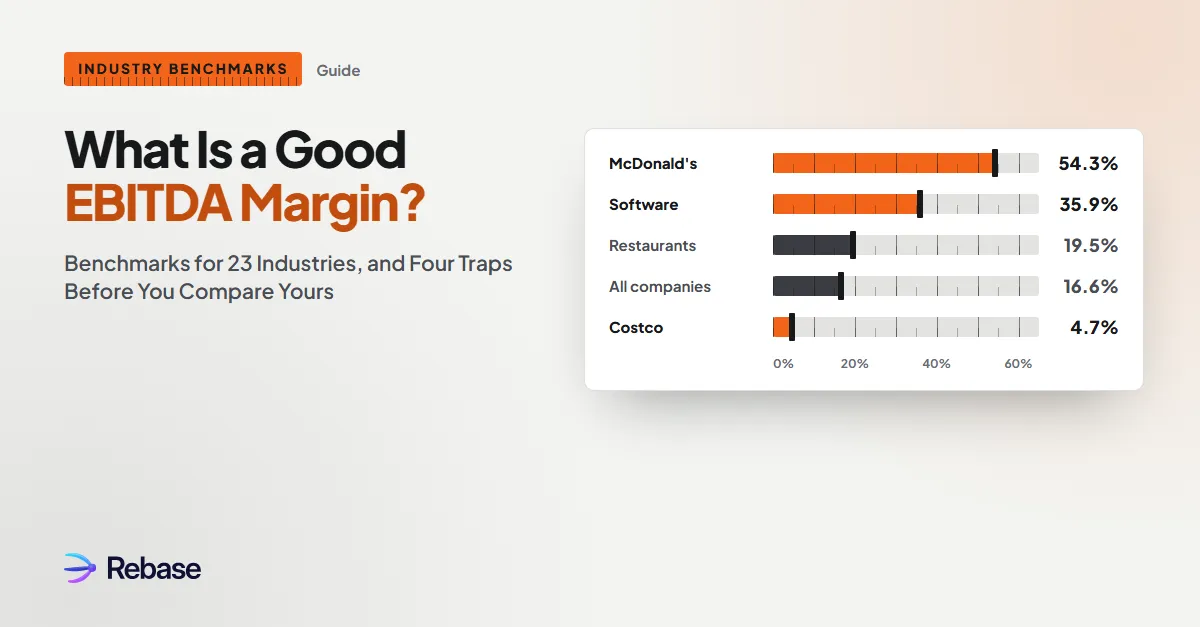
Do the same with your accounts: take out gains on selling vehicles or property, and any one-off costs, and bring owner pay to what a hired manager would cost. What Is a Good EBITDA Margin? sets out those adjustments.
Then compare at least two years. Contractors revise their estimates of what jobs will cost as work progresses, and the revisions land in the year they are made. MYR Group disclosed that changes in job estimates reduced its gross margin by 4.4 percentage points in 2024 and 1.4 points in 2025. A single year can be one bad job.
Step 4:Read the gaps in order
Gross margin first. It shows how well jobs are priced and delivered, and it is where most of the difference between the three listed companies sits. A gap of several points to your peer is worth more attention than anything below it.
Overheads second. All three run overheads of 7% to 10% of revenue across billions of dollars of work, with the purchasing power and bonding capacity that scale buys. A smaller contractor will usually run higher. A gap here is partly scale; what matters is whether it narrows as you grow.
Cash third. Comfort Systems' customers had paid it about $2.1 billion ahead of work at the end of 2025, so it waited 27 days net for its money; MYR Group waited 54. For a smaller firm, days to get paid often decides whether growth can be funded without borrowing. Billing milestones and deposits are negotiated, not fixed.
Backlog last. Comfort Systems ended 2025 with 1.3 years of revenue under contract, after its backlog doubled in a year. Backlog says how far ahead the business can plan its crews, and whether it can afford to turn down thin-margin work.
How Rebase does this
Rebase maps your accounts and the listed companies' filings onto one template, so direct costs, overheads, depreciation and customer advances sit on the same lines for everyone, with one-offs moved to their own layer and every figure linked to the line it came from.
See your business next to the listed companies that do your work. Join the Rebase waitlist. Early members get their first comparison built with us.
Frequently asked questions
What is a good profit margin for a contractor?
Among these three listed US contractors in 2025, gross margins ran from 11.6% to 24.1% and EBITDA margins from 6.2% to 16.0%, depending mainly on the type of work.
What is a good gross margin for an HVAC contractor?
Comfort Systems, a listed mechanical contractor focused on heating, cooling and plumbing, earned 24.1% in 2025 and 21.0% in 2024.
What are billings in excess of costs?
Money a customer has paid in advance of the work being done. It reduces the days a contractor waits to be paid and funds its work in progress.
Sources: EMCOR Group, fourth quarter and full year 2025 results, including the reconciliation to non-GAAP operating income, and FY2025 Form 10-K (headcount); Comfort Systems USA, fourth quarter and full year 2025 results and FY2025 Form 10-K (headcount); MYR Group, fourth quarter and full year 2025 results and FY2025 Form 10-K (headcount). EBITDA is operating income plus depreciation and amortization, excluding EMCOR's gain on the sale of its UK operations and its related transaction costs, and gains on sales of assets at Comfort Systems and MYR Group. Days to get paid use year-end receivables and contract assets less contract liabilities (Comfort Systems: billings in excess of costs and deferred revenue) over full-year revenue. EMCOR's revenue includes its UK operations up to their sale, while its headcount is year-end US only.
 Restructuring
 Peer comparison
 Peer comparison
 Industry benchmarks
 Financial ratiosRestructuringPeer comparisonPeer comparisonIndustry benchmarksFinancial ratios